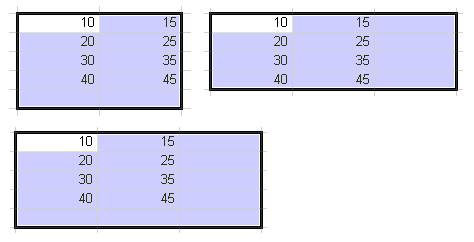
Select that range. The sum, minimum, maximum and mean values are displayed in the 2nd status bar pane.
or
-
Select a cell range as shown below:

- Click the Formula button on the toolbar and choose the desirable function.
| Entering data: Entering formulas |
To enter/edit a formula
Enter a desirable expression including the leading "=".
For example, to sum up A1, A2 and A3 and place the result in A4, enter in the A4 cell:
=A1 + A2 + A3
or
=sum(A1:A3)
to count numbers greater than 2 in the range A1:A100 and place the result in B4, enter in the B4 cell:
=countIf(A1:A100, ">2")
Other examples:
="abc"
={1, 2, 3; "abc", " 'def' ", ' "ghi" '}
=1 + 2
="a" & 'b' & 3
=fv(0.75%, 36, -500, -5500, 0)
=LProg({2,2;1,2;4,0}, {1;1;1}, {14;8;16}, {2; 4},0,,)
=sum(a1:b2, c3, 5:5, 10, sum(20, 30, 40))
=sum(A1:B2, C3, E:E, 10, sum(20, 30, 40))
=index(timeSeries($A$1:$A$100, 3, 10, 0.9), , 1)
Numbers used as arguments cannot be formatted. For example, the expression =$1,000.00 + 1 is invalid. Text strings should be delimited either by single or double quotation marks.
Note: Even if the
Settings > Options > Calculations > Automatic update mode is OFF typically
it's sufficient just to enter a given formula to display its up-to-date value.
The exceptions are formulas refering to functions that perform searching, filtering, the "..If" actions
that require internal cells sorting and can cause some delays. In this case, if the auto-update mode
is OFF, you have to perform any of the Tools > Update commands to obtain the current value of that formula after you enter/edit it.
Formulas can contain circular references. For example, if the A1 cell contains '=B2 + 1',
B2 contains '=C3 + 1' and C3 contains '=A1', then each time you update the workbook,
GS-Calc will be performing recursive/circular recalculation for those three cells.
The number of such circular updates depends on the Recursion level parameter
specified in the Options dialog box. Possible values are from 1 to 255.
Circular cell markers are displayed if that level >= 2. To list all formulas with circular references,
use the Find All > Circular Formulas command on the Find toolbar.
To browse all available formula categories and examples, use the List Of Formulas dialog box that is displayed when editing formulas or after clicking the Formula edit fields on the toolbar.
Note: Square brackets [,] in parameter lists denote parameters that are optional and can be omitted. For example:
LProg(A, s, b, c, vector, [epsilon], [m])
If your system (setting) uses commas as decimal separators, use semicolons (;) to separate function arguments or - if you prefer to use system independent (US) settings - select the generic locales via the Settings > Locales > Generic command.
Available operators:
| Operator | Operation | Comments | Precedence |
| = | Equal | Compares numbers or text strings (the comparison is not case-sensitive). Example: A1=4 , B2="abc" | 9 |
| < | Less than | Compares numbers or text strings (the comparison is not case-sensitive). Example: A1<4 , B2<"abc" | 9 |
| > | Greater than | Compares numbers or text strings (the comparison is not case-sensitive). Example: A1>4 , B2>"abc" | 9 |
| <= | Less than or equal | Compares numbers or text strings (the comparison is not case-sensitive). Example: A1<=4 , B2<="abc" | 9 |
| >= | Greater than or equal | Compares numbers or text strings (the comparison is not case-sensitive). Example: A1>=4 , B2>="abc" | 9 |
| <> | Not equal | Compares numbers or text strings (the comparison is not case-sensitive). Example: A1<>4 , B2<>"abc" | 9 |
| + | Addition | Adds numbers. | 8 |
| - | Subtraction | 8 | |
| & | String concatenation | Merges text strings. Example: A1 & "abc" , "a" & "b" | 8 |
| * | Multiplication | Multiplies numbers. | 7 |
| / | Division | Divides numbers. | 7 |
| ^ | To the power of | Calculates the power of. | 6 |
| - | Negative | Example: -A1 | 5 |
| % | Percent | Specifies a number entered as a percentage. Example: 12% | 4 |
| _ | Intersection | Specifies an (reference to) intersection of two ranges. Example: 5:5_b:b , a1:a5_a5:a8 | 3 |
| ! | Worksheet reference | Specifies a reference to another worksheet/folder. Example: sheet2!(5:5_b:b) | 2 |
| : | Range of cells | Creates a range. Example: r1c1:r5c5 , A1:B5 | 1 |
To recalculate formulas
By default, changing any cell contents updates all formulas and charts in all worksheets. Use the Tools > Automatic Updating command to turn on/off automatic updating.
To count formulas entered within the current selection, in the current worksheet or in the entire document
Use the File > Statistics command.
To find a sum, min/max/mean value etc. of a given range of cells
Select that range. The sum, minimum, maximum and mean values are displayed in the 2nd status bar pane.
or
