1. Overview
Monte Carlo simulations use random number generators to analyze formulas, estimate statistical properties, and simulate real‑world measurements or observations. They are especially useful for:
- approximating maximum or minimum values of formulas
- simulating noisy or uncertain input data
- evaluating formula behavior under random perturbations
- collecting large numbers of results for statistical analysis
In GS-Calc, simulations operate by repeatedly filling designated Input cells with random numbers and evaluating formulas in designated Output cells. Running many loops produces statistically meaningful results.
2. Simulation Components
2.1 Input Cells
Input cells must be empty or contain only numbers. During each loop, they are filled with random values generated according to the selected distribution.
Input cells may be:
- single cells
- ranges
- multiple independent regions
2.2 Output Cells
Output cells contain formulas that process the random input values and return numeric results.
Output cells may also include a rejection rule — a formula that determines whether the result from a given loop should be included in the statistics.
If the rejection formula returns a non‑zero value, the loop is rejected.
2.3 Random Number Generators
Monte Carlo simulations use the same random number generators as the mtxRand functions. You may specify generator parameters when creating a simulation.
See the mtxRand2() documentation for details on:
- distribution types
- seed behavior
- independent vs. sequential random series
3. Simulation Management
The following commands are available under the Simulations menu:
- Add Simulation — create a new simulation with input/output cells and optional generator parameters.
- Duplicate Simulation — create a copy of an existing simulation.
- Delete Simulation — remove the selected simulation.
- Delete All Simulations — remove all simulations.
4. Adding Input and Output Cells
4.1 Input Cells
Input cells must be numeric or empty. They are filled with random values during each loop.
4.2 Output Cells
Output cells contain formulas that compute results from the input values. Only numeric results are valid.
4.3 Rejection Rules
A rejection rule determines whether a loop’s output should be included in the statistics.
If the rejection formula returns a non‑zero value, the loop is rejected.
5. Example I — Linear Programming Approximation
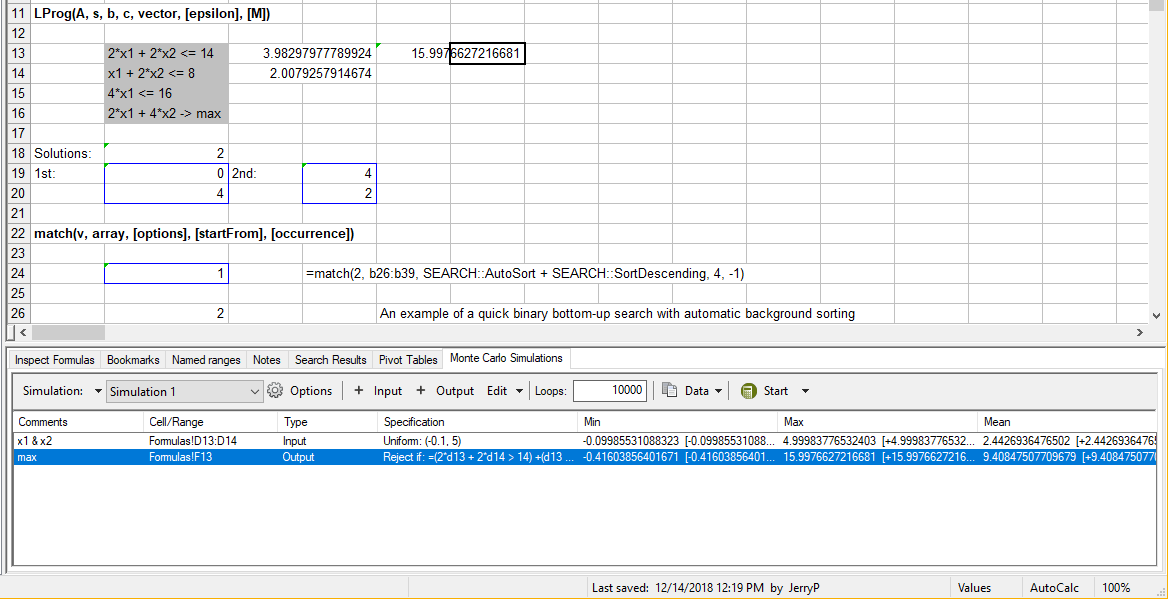
Consider the linear programming problem:
2·x1 + 2·x2 ≤ 14
x1 + 2·x2 ≤ 8
4·x1 ≤ 16
Maximize: 2·x1 + 4·x2
5.1 Input Cells
Specify D13 and D14 as input cells with uniform distribution (−0.1, 5).
5.2 Output Cell
Specify E13 as the output cell with:
=2*d13 + 4*d14
5.3 Rejection Rule
Use the following rejection formula:
=(2*d13 + 2*d14 > 14) + (d13 + 2*d14 > 8) + (4*d13 > 16)
5.4 Results
After 10,000 loops (default generator parameters), the maximum of E13 is approximately:
15.997
with:
- x1 ≈ 3.983
- x2 ≈ 2.01
The exact values computed using LProg() are:
- Maximum = 16
- x1 = 4
- x2 = 2
Note: You may add multiple output cells with separate rejection rules instead of merging them.
6. Example II — Estimating π Using Monte Carlo
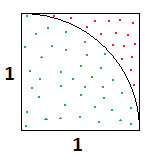
To estimate π, generate random points inside a unit square and count how many fall inside the quarter circle of radius 1.
6.1 Input Cells
Specify B2 and B3 as input cells with uniform distribution (0, 1). These represent random (x, y) pairs.
6.2 Counting Points
The green points lie inside the quarter circle. Thus:
(green points) / (all points) = π / 4
6.3 Adding Control Cells
- Add the total number of loops to B5.
- Add the number of non‑rejected loops (green points) to B6.
6.4 Output Formula
Enter the following in D2:
=b6/b5*4
Add it as an output value.
6.5 Rejection Rule
Use:
=sqrt(b2*b2 + b3*b3) > 1
This rejects points outside the quarter circle.
6.6 Running the Simulation
Specify the number of loops and click Start. After completion, D2 contains the π estimate.
To save all loop data and track how the estimate evolves, use:
Results → Save All Loop Data
Up to ~3 billion loops can be saved (256 × 12M).
7. Viewing Min/Max
Selecting an item in the Input/Output list and choosing Data → Show Min/Max fills the worksheet cells with the input/output values from the loop where the minimum or maximum occurred.
8. Saving Loop Data
After completing the specified number of loops, results may be saved as a new worksheet.
Loops are saved in rows. If the number of input/output cells exceeds 4096 columns, the saved data will be truncated.
Ranges are expanded into individual cells.
9. Running, Cancelling, and Resuming Simulations
Simulations may be stopped and resumed at any time.
During execution, the input/output list updates every 0.5 seconds, showing:
- maximum
- minimum
- mean
- variance
- standard deviation
- counter (excluding rejected loops)
Values in square brackets [ ] show changes since the previous update.
Starting a simulation pauses pending workbook updates, and vice‑versa.