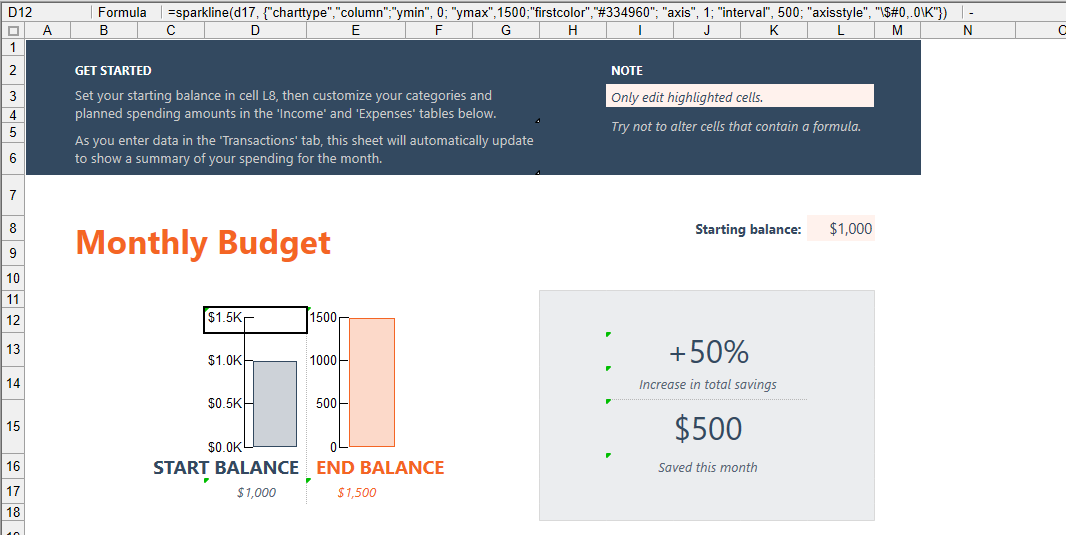
You can use the SPARKLINE() functions as a cell formula. It requires two paramerts: the chart data point values and an array with chart setup parameters.
This is a standard Google Sheet function and you can check its full description online.
Additionally GS-Calc
can also use the "interval" and "axisstyle" parameters:
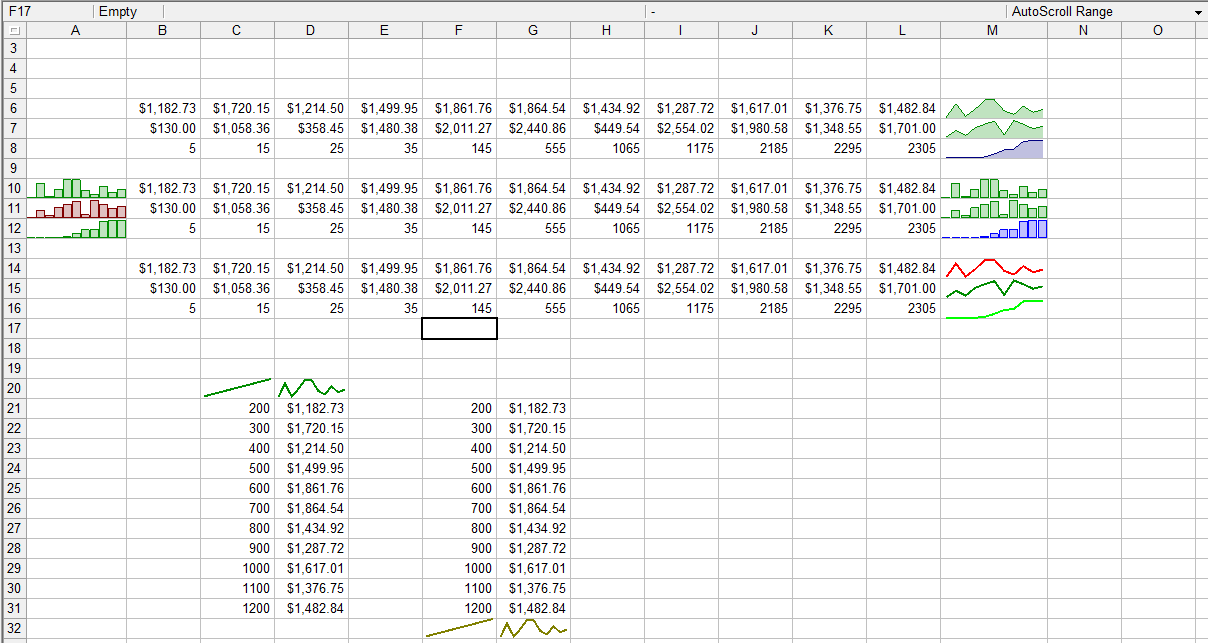
The Format > In-Cell Chart command enables you to create any number of cell mini-charts displayed
with a single click.
All parameters and display options are set up automatically. By default, you apply this in-cell format to a cell(s) at the end
of a data series placed in a row. However, the chart(s) can be also displayed at the beginning of a series in a row or above
or below a series in a column - a plain cell text alignment determines this:
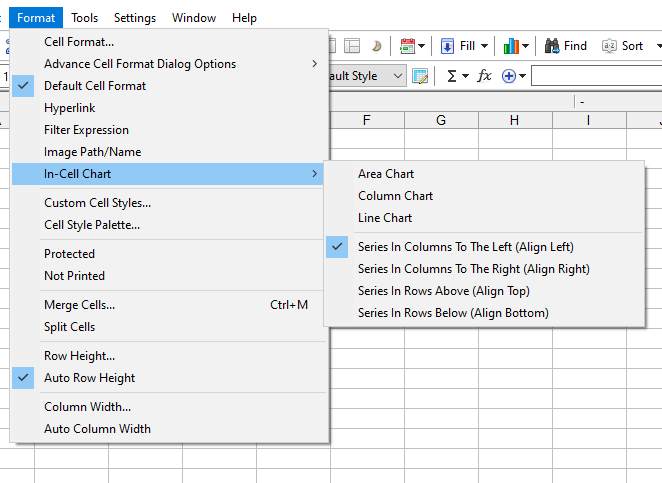
The Format > In-Cell Chart menu:
Sample In-Cell charts: