| Using Pivot Tables |
Pivot tables enable you to quickly and easily obtain and visualize various statistical information about the data stored in flat source record tables. This includes (but is not limited to) counting, summarizing, sorting or finding partial maximum/minimum and mean values. (see: Pivot Table Functions)
Tip: you can create up to 100 pivot tables for each table in the database file with up to 256 million rows each. Once a pivot table is created, clicking the "Update" always applies to the current filtered record set. If your current filtered pivot table category column has more unique values than the above ~16K limit:
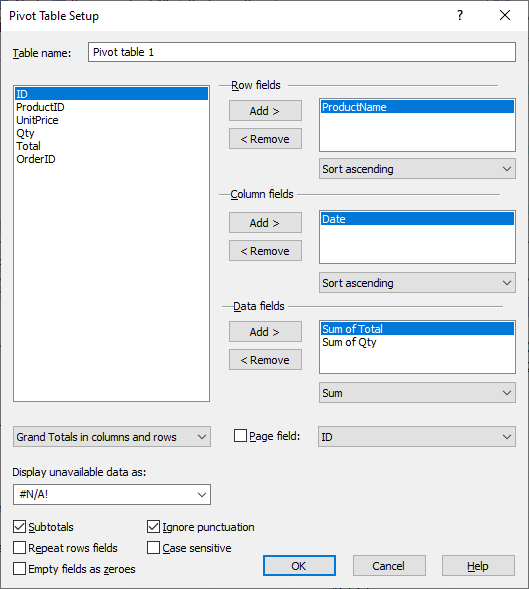
To create a new pivot table, use the View > Pivot Table View command and in the opened pivot table pane click Pivot Table > Add New Pivot Table or - if this is the first pivot table - simply click the Setup button:
Quick start
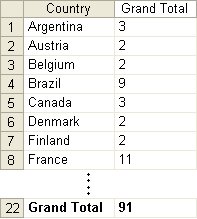
Open the included sample "sample.zip" database and choose the "customers" table.
The records contain (among others) the "Country" and "City" fields.
To obtain the number of customers from particular countries:
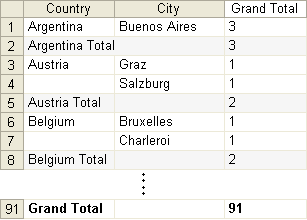
To obtain the number of customers from particular countries and to find out how many of them come from given cities in that country:
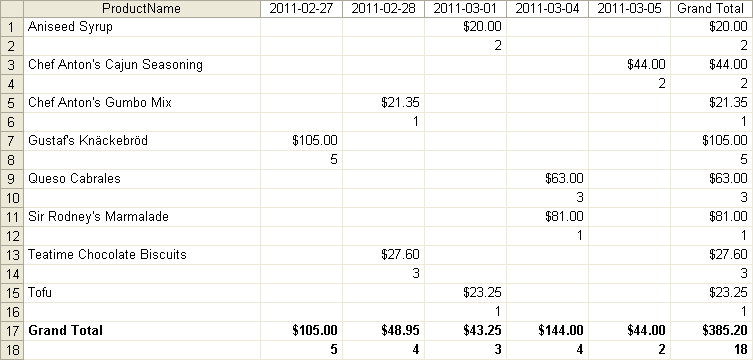
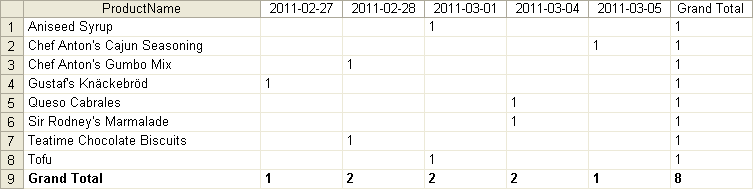
Open the included sample "sample.zip" database and choose the "orders" table.
The records contain (among others) the "ProductName" and (order) "Date" fields.
To obtain the numbers of sold products and to find out how these numbers looked like in subsequent days:
To obtain the numbers of sold products and to find out how both these numbers and the sales totals looked like in subsequent days: