| Formatting: Charts in Record Fields |
The Format > In-Field Chart command enables you to create any number of cell mini-charts
with a single click.
All parameters and display options are set up automatically. You can change the data series color by changing the font color
for a given field. The number of charts is practically unlimited: it's 256 millions times the number of fields using this format.
The maximum series size equals the maximum column number minus one.
By default, you apply this in-field format to a field(s) at the end of a data series placed in a group of sebsequent fields.
However, the chart(s) can be also displayed at the beginning of such a series by specifying field text alignment to the right.
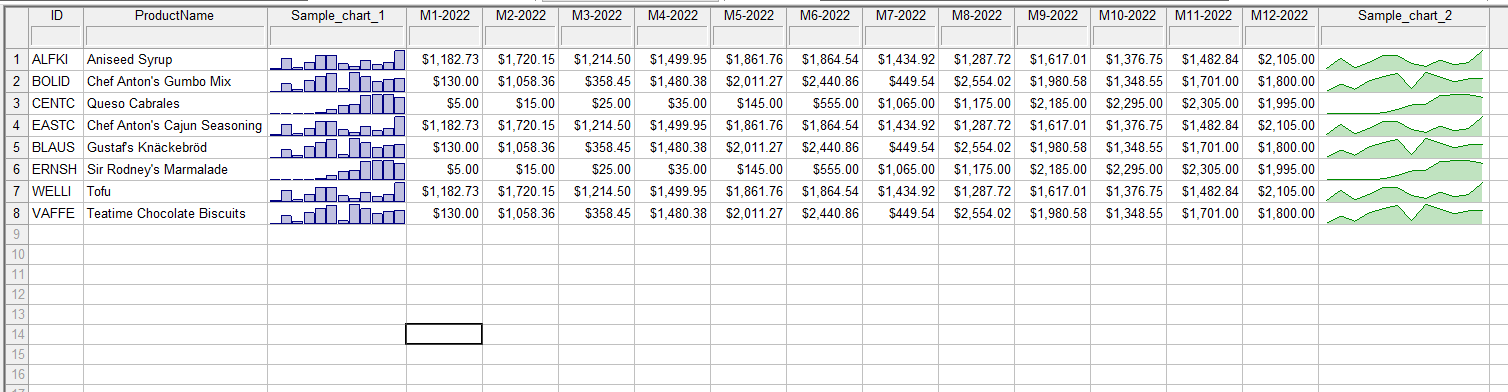
Sample In-Field charts: