GS-Calc
GS-Calc is a modern spreadsheet with unique capabilities for processing big data sets. You can edit large CSV files with millions of rows, XLSX files that are automatically split and merged, build complex data models e.g. with millions of look-up formulas that are opened/updated almost instantly and clean, transform, publish multi-gigabyte data sets.
Release date: 2026-02-24
System: Windows 7, 10, 11 64-bit
- 32 million rows x 16,384 columns. Loaded text/CSV files that exceed the 32M/16K limits are automatically split into multiple sheets and saved together as a zipped collection of text files.
- Unlimited workbook file size and best possible loading/saving speed. A workbook file with 500 million random numbers can be opened in 30 seconds on an old, slow PC with 16GB RAM.
- Efficient data compression allowing you to save, for example, 20 million formulas as a 5KB file (see how).
- Organizing worksheets in a tree form and creating 3D array cell references for worksheets in a given subfolder.
- Over 450 built-in functions which can automatically detect array arguments and return dynamic 2D array results and images.
- Up to 64 processor cores that can be used to perform calculation with no restrictions for all types of formulas.
- Performing recalculation you can refer to any number of closed workbooks of any size using any formulas.
- You can extend the above set of functions any way you want to calling your functions from Python modules in GS-Calc formulas as User Defined Functions (UDF). Python functions can return to GS-Calc any type of data including single values, matrices, dynamic images or even entire CSV files.
- If you need the best performance, instead of Python, you can also add your functions written in C++/C in DLL libraries. Such functions can even replace the built-in ones ensuring the same performance, dynamic 2D array results and multithreaded updates.
- VLOOKUP, HLOOKUP, MATCH, UNIQUE, FILTER functions using regex and fast binary searching to ensure the best performance for worksheets with millions of rows. For example, one million vlookup() functions in a table with a few million rows can be updated almost instantly even on a slow, old pc with 8GB RAM.
- The FILTER() function to quickly filter millions of rows (and/or to perform multi-key sorting and searches for duplicates).
- Fully configurable cross-highlighting and dark modes to ensure the best screen readability and to fit personal preferences.
- Each single worksheet can be separately split into up to 100 panes to display various regions of that worksheet or other worksheets. and you can password protect such view layouts.
- Mass modifying/adding/removing parameters/arguments used by functions in large workbooks without the risk of making mistakes in long formulas no matter how complex they are. (see how >>)
- Unlimited number of hyperlinks and unlimited number of conditional formatting functions in sheets.
- Fast milticolumn drop-down lists with up to 32 million items.
- Fast pivot tables with up to 32 million rows, built-in reports, full regex filtering, statistics.
- 25 pivot table data functions (vs 11 in Excel).
- Pivot tabels can be used as formulas or as separate documents in dedicated view panes.
- Charts easily handling millions of data points with custom (grid-)lines and iso-lines.
- Up to 16 independently scaled axes on each chart.
- Unlimited number of fully parametrized (Google Sheets compatible) sparkline() functions in sheets.
- Unlimited number of in-cell charts as formatting styles.
- Loading/editing/saving CSV, text, xls, xlsx, dBase, Clipper, FoxPro, MySQL, SQLite files with up to 32 million rows (and up to 1 million columns for text files).
- All opened files are edited in-place: if you click "Save" they are saved back in their format with their original structure and parameters.
- Compare files in any format, workbooks, sheets, ranges and generate reports with (hyperlinks to) differences.
- Verify data integrity with SHA256 checksums when switching between file formats. You can calculate control sums separetely for several data categories.
- Built-in solver functions (formulas) with no limits for the number of variables.
- Linear programming including integer, binary and mixed programing, quadratic programming.
- Various optimization functions. Equation sets. Time series analysis.
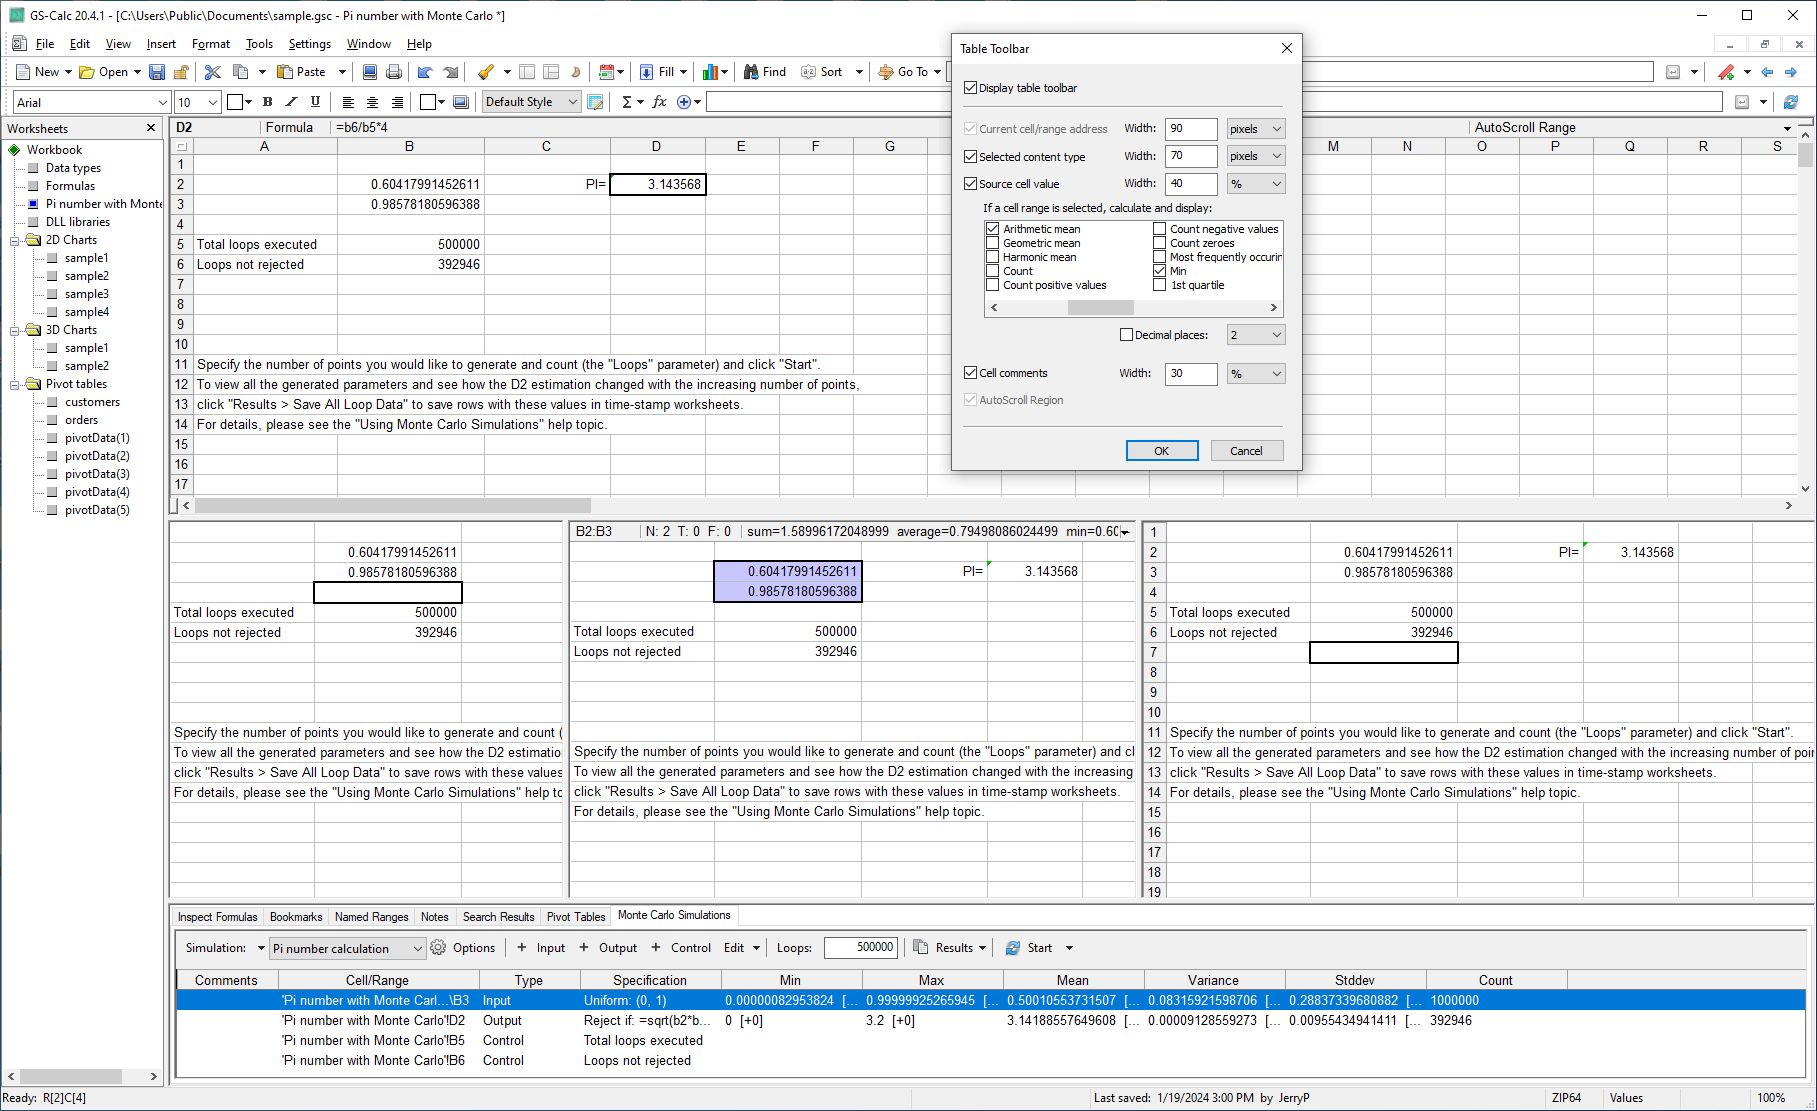
- Built-in fast Monte Carlo Simulations with detailed reports for models of any complexity.

Use your G.Sheets workbooks and templates with sparkline() functions without any limits.

Browse and edit your data in configurable panes featuring various viewing/scrolling synchronization options.

Use pivot tables with up to 32 millions rows and 16384 columns, either as formulas or in separate panes.

Create custom iso-lines and -bands on contour charts.

Easily definable data point labels, up to 16 chart axes, x-, y-, z-data series of any size.

Define your own color schemes in edited formulas.

Extensive formatting options and unlimited conditional formatting.

Use fast, multi-column drop-down lists with up to 32 million items.

Create Filter() formulas with a single click. All data is already formatted and you can instantly filter millions of records, sort or find duplicates. Use regular expr., patterns, relations etc. Automatically created hyperlinks to the source data make jumping to the data and back easy.

Any number of in-cells charts with up to 32 million data point series.
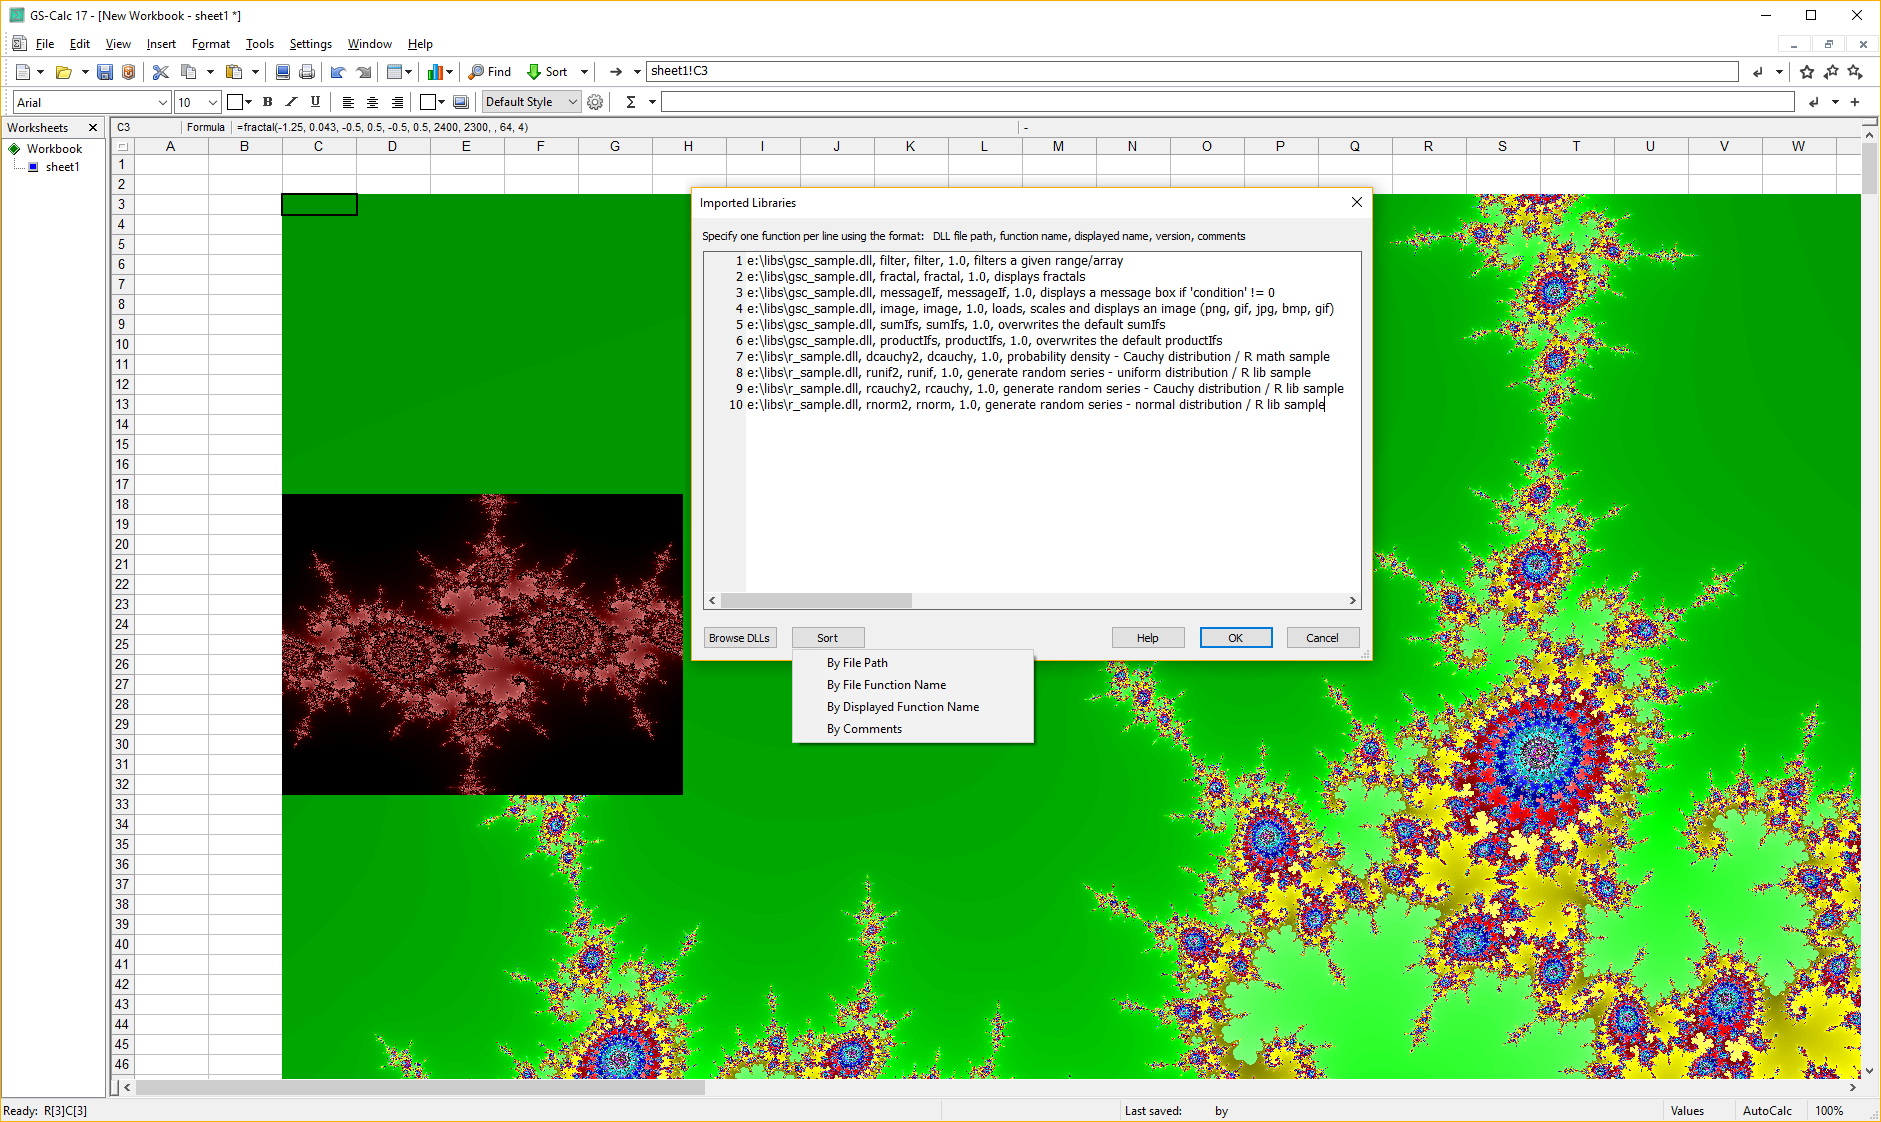
Add any number of your own functions (or replace existing ones) like the included sample fractal() formulas.

Use Python scripts stored directly in workbooks or as global resources.
Configure up to 100 (opt. synchronized by rows and/or columns) panes for each worksheet. Add automatic functions for selections.
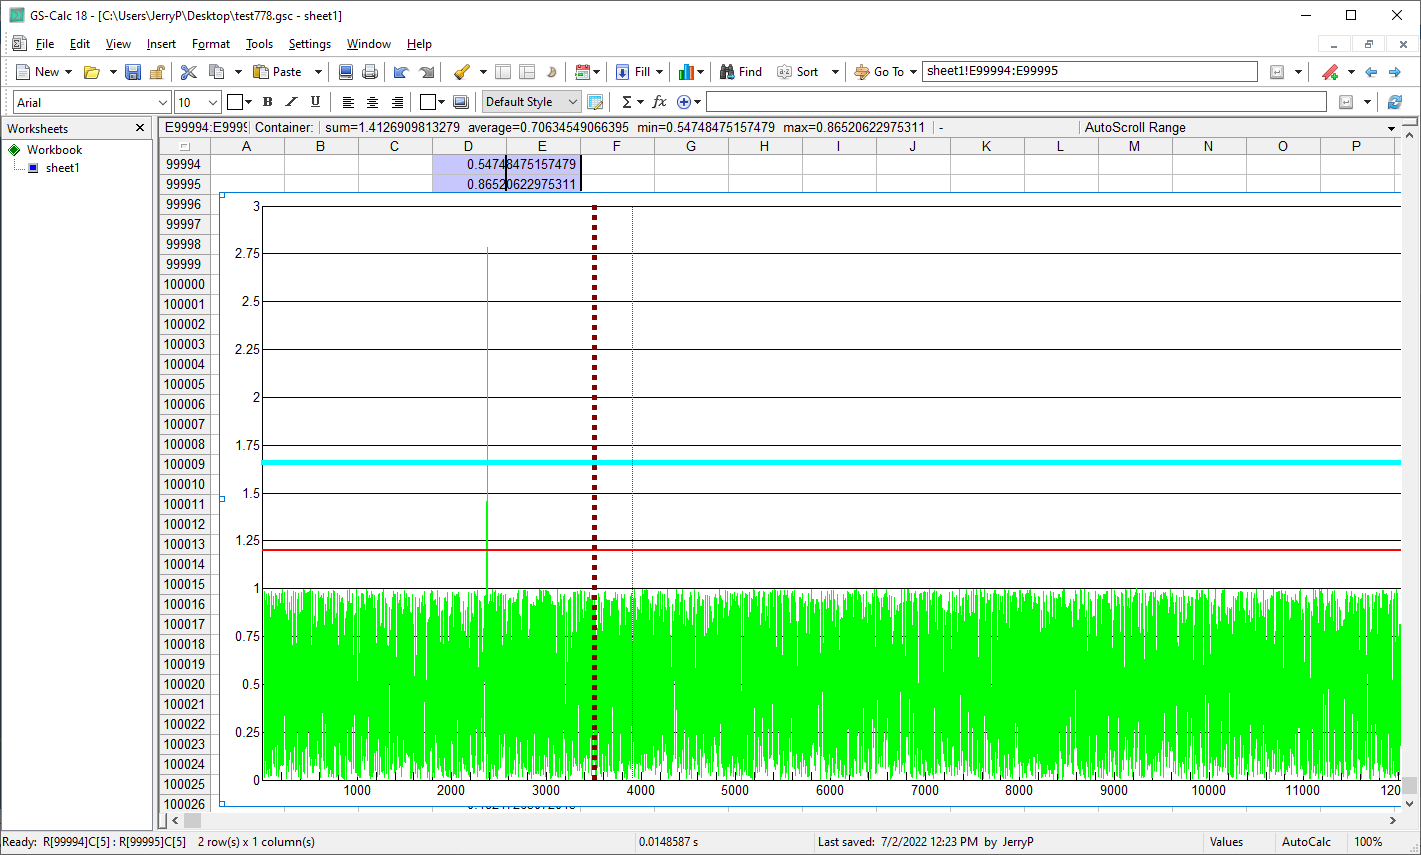
Use custom grid-lines, generate series with formulas returning arrays/vectors. Update charts with millions of data points instantly.
Videos created on Intel Core i5-7500 @3.40GHz / 16GB RAM; CPU benchmark 8K [ vs 60K for Intel Core i9-13900K ]
Using the FILTER() function to filter 3.3 million rows.
Using a 2.37GB workbook file with i5, 16GB RAM & HDD:
32 million formulas and 300 million random number/text cells.
Creating a script in GS-Calc to mass-import tables from CSV/text/xBase/xlsx files
Using MonteCarlo simulations to find sets of 100 numbers that add up to a give value.
MonteCarlo simulations in GS-Calc to find linear programming solutions.
12 million fast binary VLOOKUP's in GS-Calc.